Where Are America’s UFO Hotspots?
What Can UFO Data Tell Us?
UFOs have fascinated people for generations. Whether they represent extraterrestrial visitors, misunderstood natural phenomena, or simply the quirks of human perception, millions of people have looked to the skies and wondered.
In this series, we’re taking a different approach. Using more than 80,000 documented UFO sightings, we’ll investigate one question at a time through the lens of data science. Rather than asking whether UFOs are real, we’re exploring what these reports reveal about human behavior, culture, and the ways we document the unexplained.
After all, even if the mystery remains unsolved, the data have a story to tell.
Previous Entries
- Did Hollywood Make People See More UFOs? A Data Analysis
- Did the Internet Cause the UFO Reporting Boom?
- Did Smartphones Change UFO Sightings?
- Did the Internet Make People Report UFO Sightings Faster?
- Did UFOs Change Shape Over Time?
The Hotspot Hypothesis
Every map of UFO sightings seems to tell the same story.
California glows.
The Pacific Northwest lights up.
Florida looks unusually active.
But are these truly UFO hotspots, or simply places where more people live?
That’s an important distinction. If Los Angeles reports more UFOs than rural Wyoming, that may simply reflect the fact that millions more people are watching the sky.
To answer this question, we analyzed more than 70,000 geocoded UFO sightings across the contiguous United States, comparing raw reports with county population to determine whether some places experience more sightings than population alone would predict.
First Look: UFOs Are Everywhere
Mapping every reported sighting immediately reveals that UFO reports are remarkably widespread.
Reports occur in every region of the continental United States, from dense metropolitan areas to sparsely populated deserts and mountain communities.
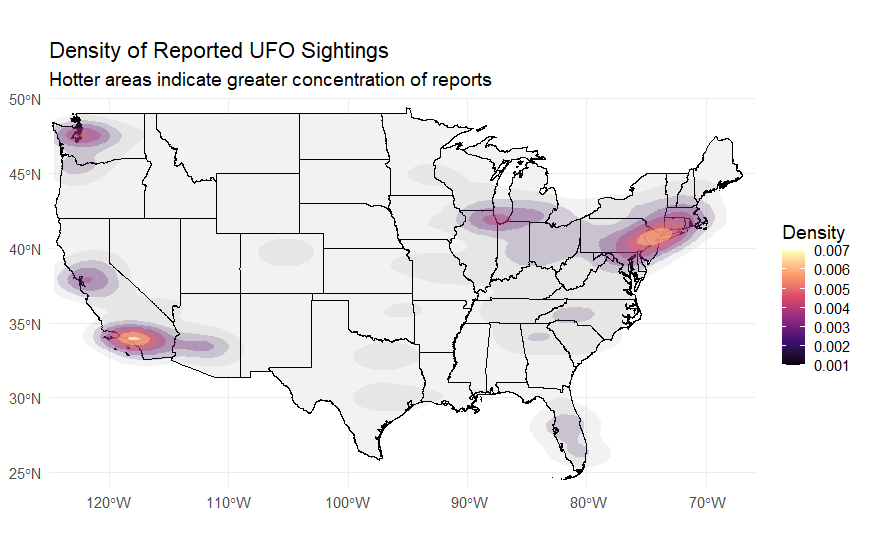
While clusters are immediately visible along both coasts and around major metropolitan areas, raw maps can be misleading because they largely reflect where people live.
California Leads the Nation
Looking simply at total reports, California dominates the dataset with 9,625 documented sightings. It is followed by Washington (4,270), Florida (4,200), Texas (3,684), and New York (3,235).
At the county level, the largest counties also lead the rankings.
Los Angeles County alone accounts for nearly 2,000 reports, followed by Maricopa County (Arizona), King County (Washington), San Diego County, and Cook County (Illinois).
None of these results are particularly surprising.
Large populations generate large numbers of observations.
The more interesting question is whether population explains all of the variation.
Population Explains a Lot—but Not Everything
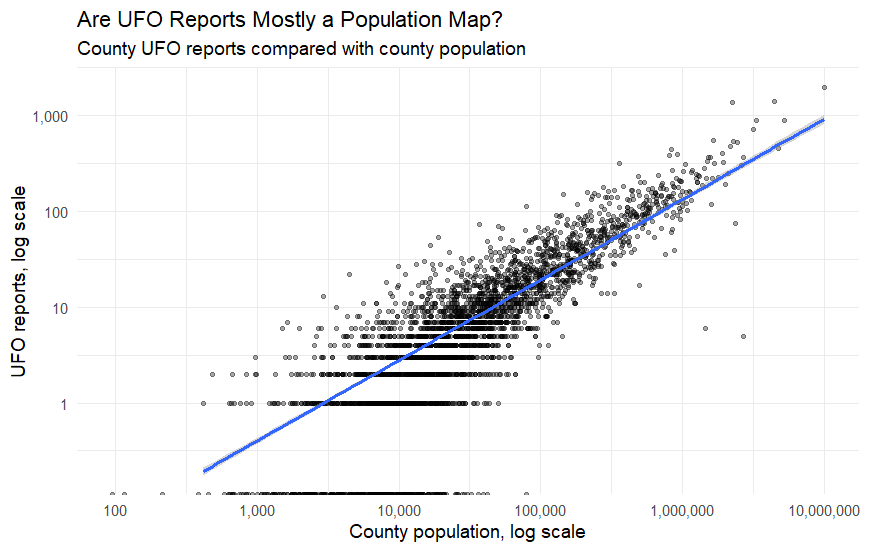
When we compared county population with the number of reported UFO sightings, the relationship was remarkably strong.
Across U.S. counties, the correlation between population and UFO reports was 0.89, while the correlation using logarithmic scaling remained 0.86.
A simple regression model showed that county population alone explained nearly 75% of the variation in UFO reports (R² = 0.747).
This is an important finding.
Most UFO maps are, to a considerable degree, population maps.
More people means more observers, more opportunities to notice unusual events, and more potential reports.
But population was not the whole story. Approximately one-quarter of the variation remained unexplained.
The Places That Punch Above Their Weight
Once population is taken into account, a very different map emerges.
Rather than major cities, many of the strongest hotspots are small, rural counties that report far more UFO sightings than their population would predict.
Among the most striking examples are:
- Lincoln County, Nevada
- Lincoln County, Kansas
- Inyo County, California
- La Paz County, Arizona
- Eureka County, Nevada
- Dare County, North Carolina
- Mono County, California
- Lake County, Oregon
- Lincoln County, Washington
These counties have relatively modest populations but exceptionally high reporting rates compared with statistical expectations.
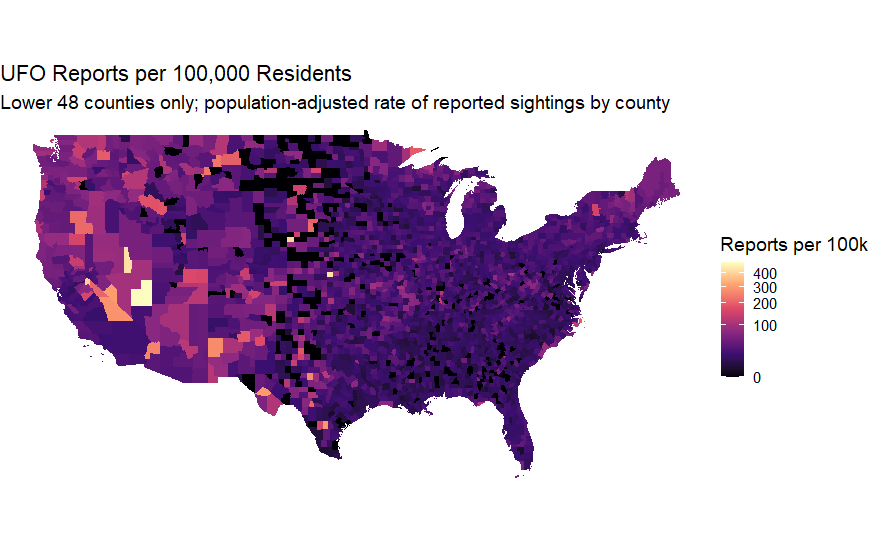
Some of these locations are immediately recognizable to UFO enthusiasts. Others are simply remote regions with expansive skies, dark nights, and relatively little light pollution.
Are There Genuine Geographic Clusters?
To answer that question, we applied a spatial clustering algorithm that groups nearby sightings while ignoring isolated reports.
The analysis identified dozens of statistically distinct clusters, including two very large nationwide concentrations and many smaller regional clusters.
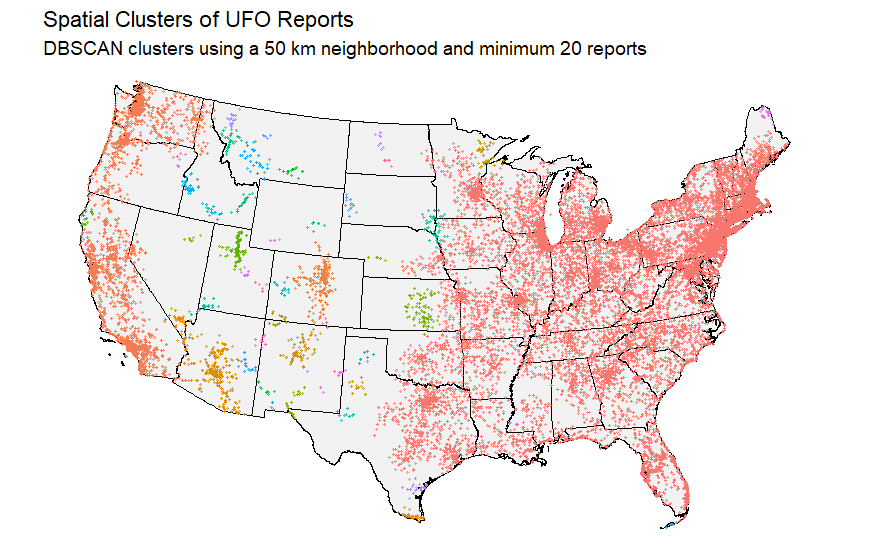
These clusters suggest that sightings are not randomly distributed across the country.
Instead, reports tend to accumulate in particular regions—especially along the West Coast, the Pacific Northwest, portions of the Southwest, and parts of the Southeast.
Whether these clusters reflect environmental conditions, population patterns, reporting culture, or something else entirely remains an open question.
Do UFOs Prefer the Coast?
One commonly suggested explanation is that UFO sightings are concentrated near coastlines.
Our analysis offers only limited support for that idea.
The median reported sighting occurred approximately 196 kilometers (122 miles) from the nearest coastline, while the average distance was 354 kilometers, reflecting the many reports originating from the nation’s interior.
In other words, although many sightings occur near the coasts, UFO reports are hardly a purely coastal phenomenon.
The American interior contributes tens of thousands of reports as well.
What Explains the Remaining Variation?
If population explains three-quarters of all reported sightings, what explains the rest?
Several possibilities stand out.
Some regions may simply provide better viewing conditions because of darker skies, clearer weather, or expansive landscapes.
Others may have stronger UFO-reporting cultures, with residents more likely to document unusual events.
Tourism may also play a role. Areas known for outdoor recreation, national parks, or desert landscapes expose more people to unobstructed night skies than dense urban environments.
Finally, there is the simple reality that unexplained aerial phenomena include everything from satellites and meteors to military aircraft, atmospheric optics, and astronomical events.
Different environments expose observers to different kinds of unusual objects.
The Bigger Lesson
One of the biggest surprises from this analysis is how ordinary much of the UFO map appears.
The strongest predictor of UFO reports isn’t proximity to Area 51 or mysterious mountain ranges.
It’s population.
But once population is accounted for, genuinely interesting patterns begin to emerge. Rural counties across Nevada, Arizona, California, Oregon, Washington, and other western states report substantially more sightings than expected, suggesting that geography, environment, and human behavior all contribute to where UFO reports originate.
The result doesn’t prove where UFOs are.
It does show where people are most likely to report seeing something they cannot explain.
And sometimes, that’s an equally fascinating mystery.