Every Coffee Drinker Depends on Farms Most Maps Can’t See.
In Uganda, millions of small coffee plots are so mixed with trees and food crops that, from space, they often disappear into green blur.
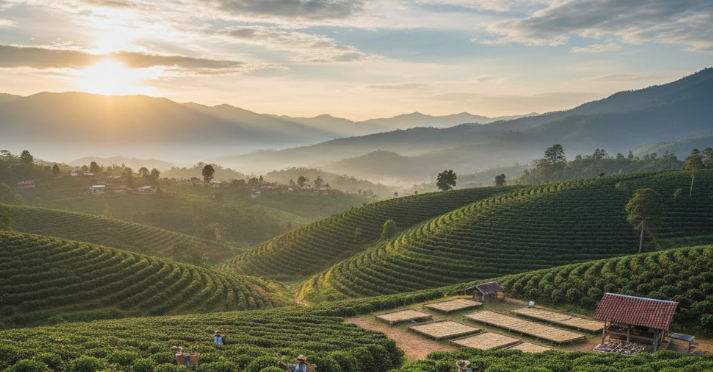
Picture a hillside in western Uganda. Coffee shrubs grow beneath tall shade trees. Bananas rise between rows. A farmer walks through the plot, deciding where pests are spreading and where yields are falling. Now imagine trying to support that farmer with national data—without knowing what kind of coffee system they use.
That’s the challenge this new study set out to solve: how do you map complex, small-scale coffee farms accurately when each field is a patchwork?
And the answer turns out to be smarter—not sharper—satellites.
Seeing coffee like a layered meal, not a single ingredient
Traditional satellite maps treat land like a plate with one food on it: forest or crops or buildings. But real farms, especially in low- and middle-income countries, are more like stews. One spoonful might include coffee leaves, banana plants, shade trees, and soil—all at once.
The researchers used a clever idea: instead of asking “What is this pixel?”, they asked “What is this pixel made of?”
That shift changed everything.
The “aha” moment: Two steps are better than one
The research team worked across Uganda’s main Robusta coffee regions, where farms are often smaller than half a hectare. First, they used Sentinel-2 satellite imagery to separate broad land types—forest, water, cities, agriculture, and coffee areas.
That part worked well. But here’s the twist: coffee itself still looked messy. Shaded, banana-intercropped, and full-sun coffee are often blended together.
So the researchers added a second step.
They zoomed inside each coffee pixel using a technique called spectral unmixing. Think of it like listening to a choir and identifying how much soprano, alto, and bass you hear at once. Each pixel became a mix of three coffee systems:
- Coffee grown under trees (agroforestry)
- Coffee mixed with bananas
- Coffee grown in full sun
Suddenly, the blur had structure.
What the satellites finally revealed
With this two-step approach, the team mapped coffee systems with nearly 90% accuracy, a major leap for such complex landscapes.
Here’s what they found across Uganda:
- Nearly two-thirds of Robusta coffee is grown under agroforestry shade
- About one-quarter is intercropped with bananas
- Only one in ten coffee areas is full-sun monoculture
That matters because these systems behave very differently. Shade-grown coffee responds differently to heat. Banana-mixed systems affect household food security. Full-sun coffee is often more vulnerable to pests and climate stress. Until now, many policies treated them as the same.
Why this matters far beyond Uganda
This study isn’t just about coffee—it’s about how science supports small farmers in a changing world.
Accurate maps help:
- Target pest control before outbreaks spread
- Match fertilizer and extension advice to real conditions
- Plan climate adaptation based on actual farm systems
- Avoid wasting resources on the wrong places
For countries facing heat, erratic rainfall, and tight budgets, this approach offers something powerful: precision without expensive new satellites.
And because Sentinel-2 data are free, the method can be reused across Africa, Latin America, and Southeast Asia.
The bigger lesson: Better questions beat better technology
For years, researchers tried to solve this problem by chasing higher resolution—sharper images, more pixels, more data. This study shows another path.
By asking what’s inside each pixel instead of what label fits best, scientists unlocked detail that was already there.
It’s a reminder that innovation isn’t always about new tools. Sometimes it’s about changing how we listen to the data.
What comes next?
The authors note that farms change with seasons. Leaves yellow. Pests attack. Rain reshapes canopies. Future work could add seasonal images, drones, or farmer-reported data to make maps even smarter.
And the same method could help track:
- Cocoa in West Africa
- Tea in East Africa
- Mixed food systems everywhere smallholders farm complexity, not simplicity
Let’s Explore Together
- Could this kind of mapping help farmers in your country or region?
- If you were on this research team, what crop or system would you map next?
- What everyday problem—food, water, health—do you wish satellites could help solve better?
Science works best when it starts conversations. Let’s keep this one going.